Material parameters
Felix Fritzen fritzen@simtech.uni-stuttgart.de, Julius Herb julius.herb@mib.uni-stuttgart.de, Shadi Sharba shadi.sharba@isc.fraunhofer.de
University of Stuttgart, Institute of Applied Mechanics, Chair for Data Analytics in Engineering
Funding acknowledgment The IGF-Project no.: 21.079 N / DVS-No.: 06.3341 of the “Forschungsvereinigung Schweißen und verwandte Verfahren e.V.” of the German Welding Society (DVS), Aachener Str. 172, 40223 Düsseldorf, Germany, was funded by the Federal Ministry for Economic Affairs and Climate Action (BMWK) via the German Federation of Industrial Research Associations (AiF) in accordance with the policy to support the Industrial Collective Research (IGF) on the orders of the German Bundestag.
Felix Fritzen is funded by the German Research Foundation (DFG) – 390740016 (EXC-2075); 406068690 (FR2702/8-1); 517847245 (FR2702/10-1).
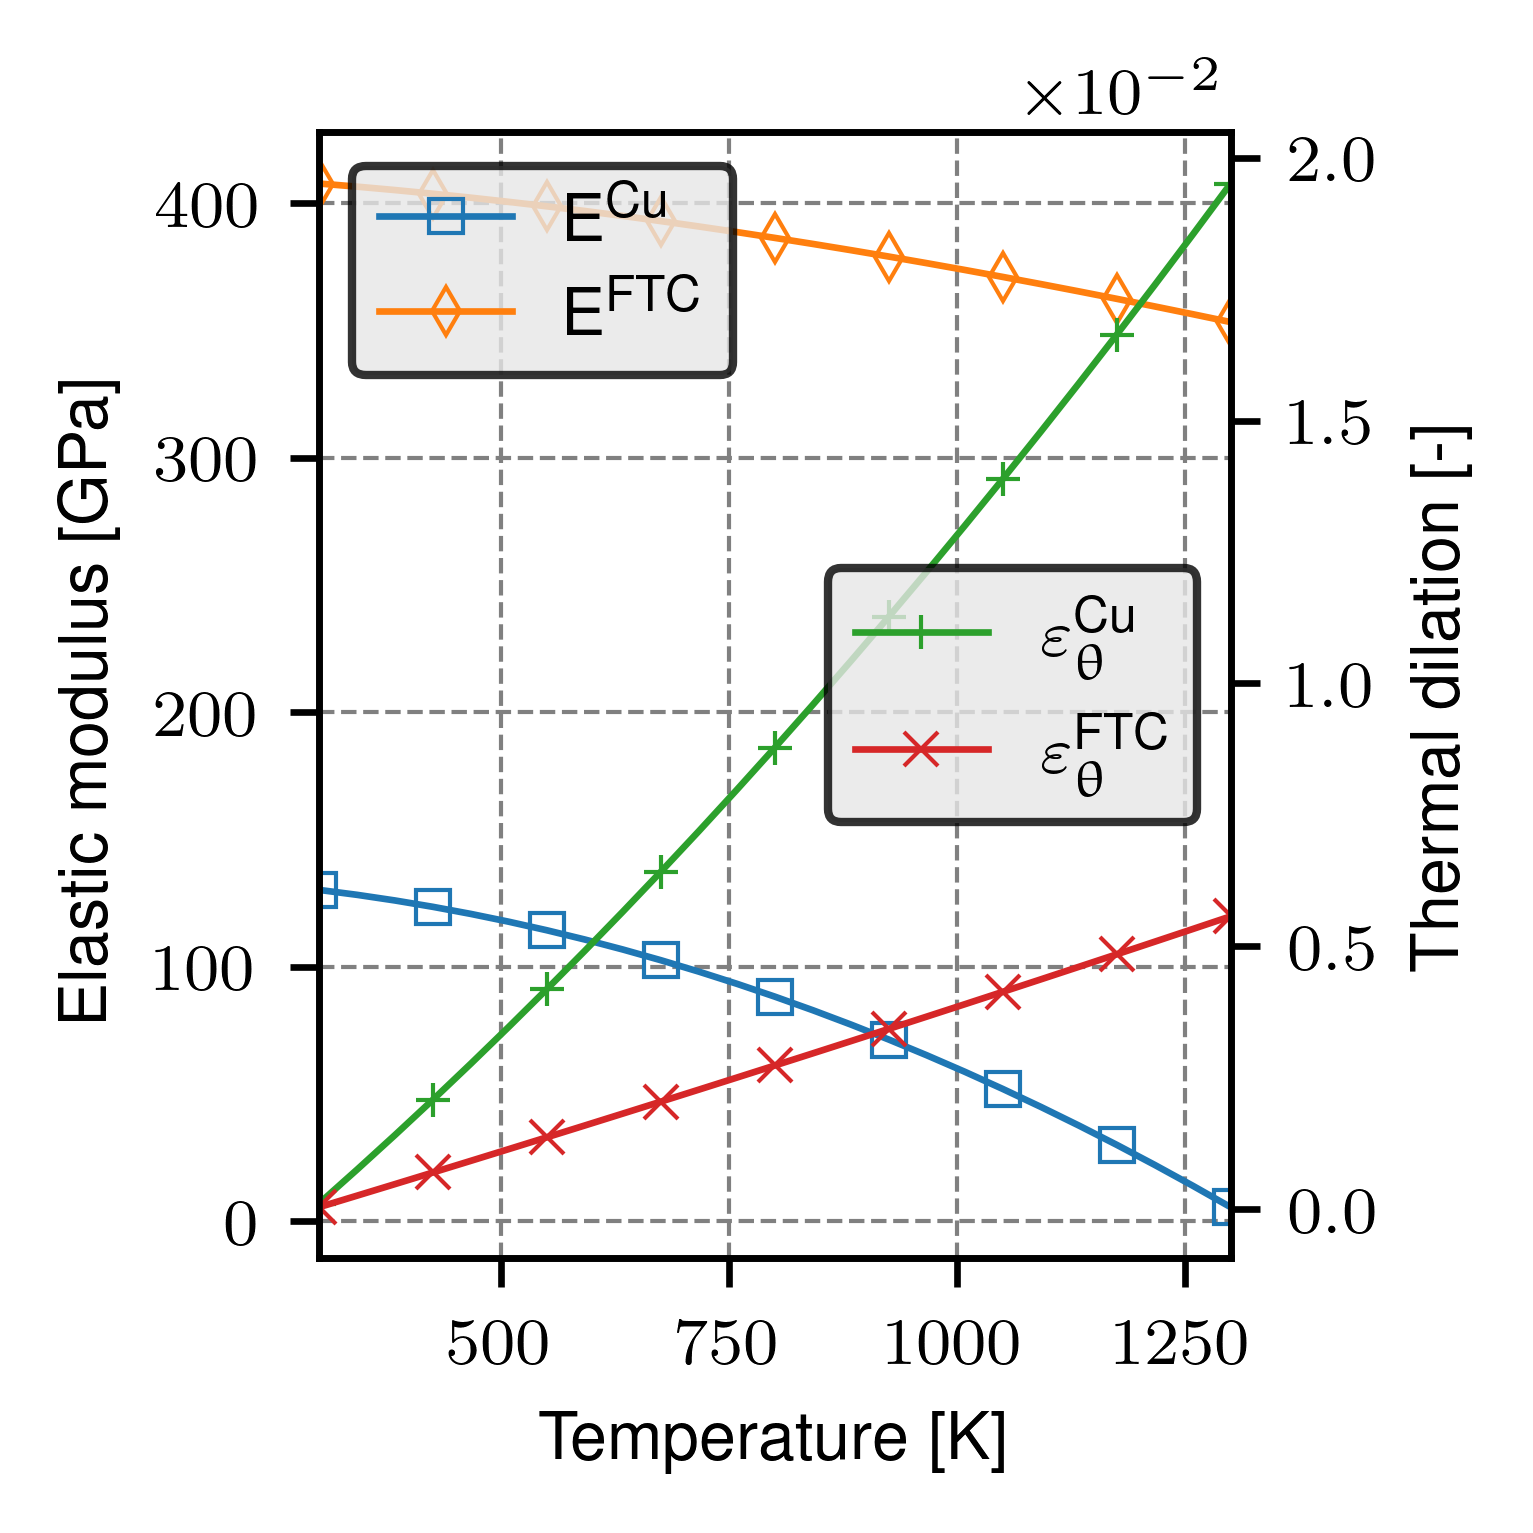
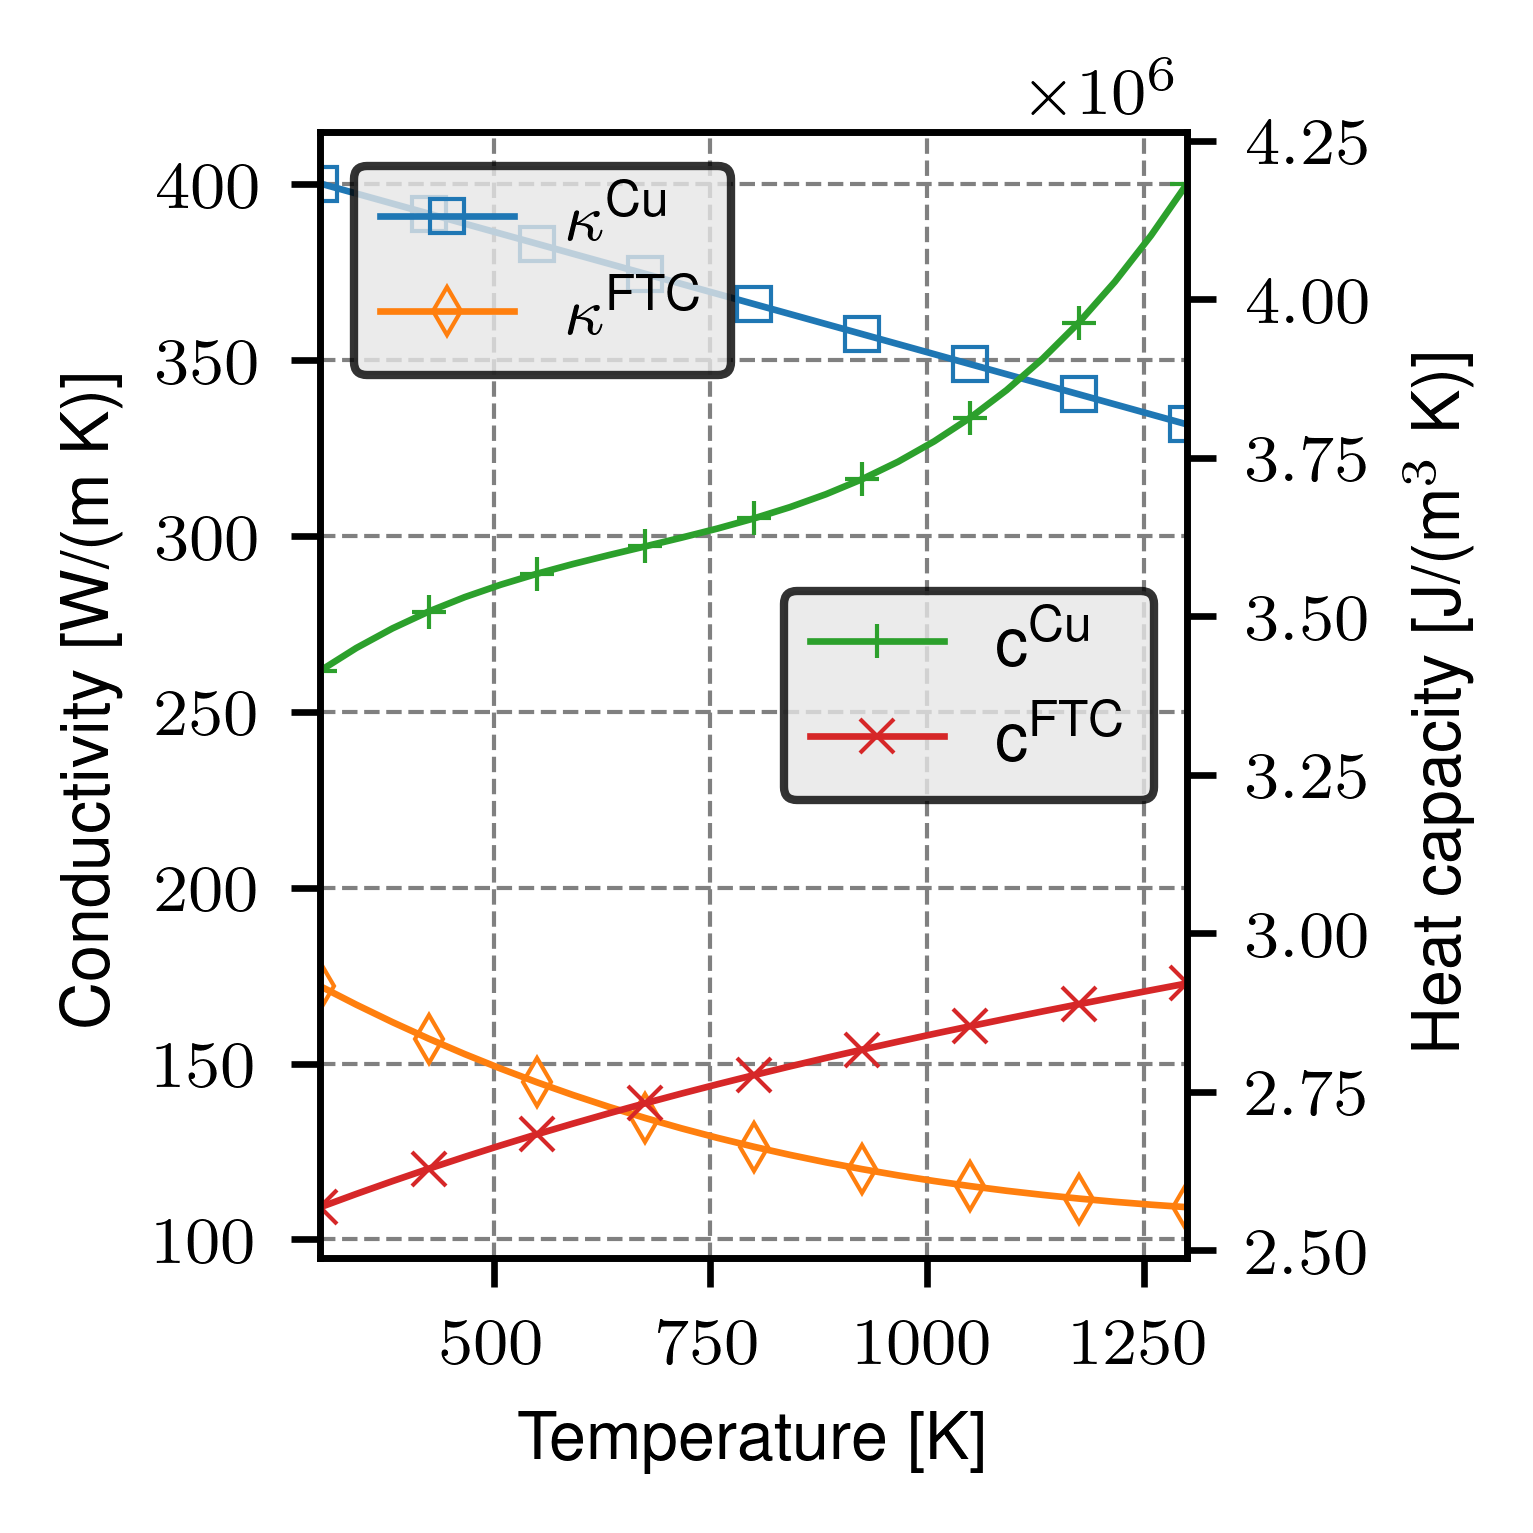
This notebook contains the temperature-dependent material parameters of copper (Cu) and fused tungsten carbide (FTC) that are used in the examples of our CMAME article.
Imports
[1]:
from typing import Tuple, Union

import numpy as np
Temperature range
[2]:
min_temperature = 293.00
max_temperature = 1300.00
Basic tensors
[3]:
I2 = np.asarray([1.0, 1.0, 1.0, 0.0, 0.0, 0.0])
I4 = np.eye(6)
IxI = np.outer(I2, I2)
P1 = IxI / 3.0
P2 = I4 - P1
Temperature-dependent material parameters of copper (Cu) phase (phase no. 0)
[4]:
poisson_ratio_cu = lambda x: 3.40000e-01 * x**0
conductivity_cu = lambda x: 4.20749e05 * x**0 + -6.84915e01 * x**1
heat_capacity_cu = (
    lambda x: 2.94929e03 * x**0
    + 2.30217e00 * x**1
    + -2.95302e-03 * x**2
    + 1.47057e-06 * x**3
)
cte_cu = lambda x: 1.28170e-05 * x**0 + 8.23091e-09 * x**1
eps_th_cu = lambda x: 1.28170e-05 * (x - min_temperature) + 8.23091e-09 * 0.5 * (
    x * x - min_temperature**2
)
elastic_modulus_cu = (
    lambda x: 1.35742e08 * x**0 + 5.85757e03 * x**1 + -8.16134e01 * x**2
)
hardening_cu = lambda x: 20e06 * x**0

shear_modulus_cu = lambda x: elastic_modulus_cu(x) / (2.0 * (1.0 + poisson_ratio_cu(x)))
bulk_modulus_cu = lambda x: elastic_modulus_cu(x) / (
    3.0 * (1.0 - 2.0 * poisson_ratio_cu(x))
)
stiffness_cu = lambda x: bulk_modulus_cu(x) * IxI + 2.0 * shear_modulus_cu(x) * P2
Temperature-dependent material parameters of wsc/FTC phase (phase no. 1)
[5]:
poisson_ratio_wsc = lambda x: 2.80000e-01 * x**0
conductivity_wsc = (
    lambda x: 2.19308e05 * x**0
    + -1.87425e02 * x**1
    + 1.05157e-01 * x**2
    + -2.01180e-05 * x**3
)
heat_capacity_wsc = (
    lambda x: 2.39247e03 * x**0
    + 6.62775e-01 * x**1
    + -2.80323e-04 * x**2
    + 6.39511e-08 * x**3
)
cte_wsc = lambda x: 5.07893e-06 * x**0 + 5.67524e-10 * x**1
eps_th_wsc = lambda x: 5.07893e-06 * (x - min_temperature) + 5.67524e-10 * 0.5 * (
    x * x - min_temperature**2
)
elastic_modulus_wsc = (
    lambda x: 4.13295e08 * x**0
    + -7.83159e03 * x**1
    + -3.65909e01 * x**2
    + 5.48782e-03 * x**3
)

shear_modulus_wsc = lambda x: elastic_modulus_wsc(x) / (
    2.0 * (1.0 + poisson_ratio_wsc(x))
)
bulk_modulus_wsc = lambda x: elastic_modulus_wsc(x) / (
    3.0 * (1.0 - 2.0 * poisson_ratio_wsc(x))
)
stiffness_wsc = lambda x: bulk_modulus_wsc(x) * IxI + 2.0 * shear_modulus_wsc(x) * P2
Plot temperature-dependent material parameters of both phases
[6]:
if __name__ == "__main__":
    import matplotlib.pyplot as plt
    import os

    preamble = r"\usepackage{amsmath} \usepackage{amsfonts} \usepackage{upgreek} \usepackage{helvet}"
    plt.rcParams.update(
        {
            "font.size": 8,
            "lines.linewidth": 0.8,
            "lines.markersize": 4,
            "markers.fillstyle": "none",
            "lines.markeredgewidth": 0.5,
            "text.usetex": True,
            "text.latex.preamble": preamble
            # \usepackage{sansmath} \sansmath
        }
    )

    cm = 1 / 2.54  # centimeters in inches
    data_path = "../data/"

    temp1 = 300
    temp2 = 1300
    n_tests = 25
    test_temperatures = np.linspace(temp1, temp2, num=n_tests)

    temp = temp1
    print(
        f"phase contrast at {temp:6}K: {elastic_modulus_wsc(temp) / elastic_modulus_cu(temp):.2f}"
    )
    temp = temp2
    print(
        f"phase contrast at {temp:6}K: {elastic_modulus_wsc(temp) / elastic_modulus_cu(temp):.2f}"
    )

    parameters = np.zeros((n_tests, 8))
    for idx, temperature in enumerate(test_temperatures):
        # print(f'{temperature = :.2f}')

        parameters[idx, 0] = elastic_modulus_cu(temperature) / 1e6
        parameters[idx, 1] = elastic_modulus_wsc(temperature) / 1e6

        parameters[idx, 2] = eps_th_cu(temperature)
        parameters[idx, 3] = eps_th_wsc(temperature)

        parameters[idx, 4] = conductivity_cu(temperature) / 1e3
        parameters[idx, 5] = conductivity_wsc(temperature) / 1e3

        parameters[idx, 6] = heat_capacity_cu(temperature) * 1e3
        parameters[idx, 7] = heat_capacity_wsc(temperature) * 1e3

    labels = [
        r"E\textsuperscript{Cu}",
        r"E\textsuperscript{FTC}",
        r"${\varepsilon}_{\uptheta}^{\text{Cu}}$",
        r"${\varepsilon}_{\uptheta}^{\text{FTC}}$",
        r"$\kappa$\textsuperscript{Cu}",
        r"$\kappa$\textsuperscript{FTC}",
        r"c\textsuperscript{Cu}",
        r"c\textsuperscript{FTC}",
    ]
    markers = ["s", "d", "+", "x", "o"]
    colors = ["C0", "C1", "C2", "C3", "C4"]

    fig_name = "mat_parameters1"
    xlabel = "Temperature [K]"
    ylabel = "Elastic modulus [GPa]"
    plt.figure(figsize=(6 * cm, 6 * cm), dpi=600)
    plt.plot(
        test_temperatures,
        parameters[:, 0],
        label=labels[0],
        marker=markers[0],
        color=colors[0],
        markevery=3,
    )
    plt.plot(
        test_temperatures,
        parameters[:, 1],
        label=labels[1],
        marker=markers[1],
        color=colors[1],
        markevery=3,
    )
    gca1 = plt.gca()
    gca2 = gca1.twinx()
    gca2.plot(
        test_temperatures,
        parameters[:, 2],
        label=labels[2],
        marker=markers[2],
        color=colors[2],
        markevery=3,
    )
    gca2.plot(
        test_temperatures,
        parameters[:, 3],
        label=labels[3],
        marker=markers[3],
        color=colors[3],
        markevery=3,
    )
    gca1.set_xlim([temp1, temp2])
    gca1.set_xlabel(rf"{xlabel}")
    gca1.set_ylabel(rf"{ylabel}")
    gca1.grid(ls="--", color="gray", linewidth=0.5)
    ylabel = "Thermal dilation [-]"
    gca2.set_ylabel(rf"{ylabel}")
    gca2.ticklabel_format(axis="y", scilimits=[0, 2])
    gca1.legend(loc="upper left", facecolor=(0.9, 0.9, 0.9, 0.6), edgecolor="black")
    gca2.legend(loc="center right", facecolor=(0.9, 0.9, 0.9, 0.6), edgecolor="black")
    plt.tight_layout(pad=0.025)
    plt.savefig(os.path.join(data_path, "results", f"{fig_name}.pdf"))
    plt.show()

    fig_name = "mat_parameters2"
    xlabel = "Temperature [K]"
    ylabel = "Conductivity [W/(m K)]"
    plt.figure(figsize=(6 * cm, 6 * cm), dpi=600)
    plt.plot(
        test_temperatures,
        parameters[:, 0 + 4],
        label=labels[0 + 4],
        marker=markers[0],
        color=colors[0],
        markevery=3,
    )
    plt.plot(
        test_temperatures,
        parameters[:, 1 + 4],
        label=labels[1 + 4],
        marker=markers[1],
        color=colors[1],
        markevery=3,
    )
    gca1 = plt.gca()
    gca2 = gca1.twinx()
    gca2.plot(
        test_temperatures,
        parameters[:, 2 + 4],
        label=labels[2 + 4],
        marker=markers[2],
        color=colors[2],
        markevery=3,
    )
    gca2.plot(
        test_temperatures,
        parameters[:, 3 + 4],
        label=labels[3 + 4],
        marker=markers[3],
        color=colors[3],
        markevery=3,
    )
    gca1.set_xlim([temp1, temp2])
    gca1.set_xlabel(rf"{xlabel}")
    gca1.set_ylabel(rf"{ylabel}")
    gca1.grid(ls="--", color="gray", linewidth=0.5)
    ylabel = r"Heat capacity [J/(m$^3$ K)]"
    gca2.set_ylabel(rf"{ylabel}")
    gca1.legend(loc="upper left", facecolor=(0.9, 0.9, 0.9, 0.6), edgecolor="black")
    gca2.legend(loc="center right", facecolor=(0.9, 0.9, 0.9, 0.6), edgecolor="black")
    plt.tight_layout(pad=0.025)
    plt.savefig(os.path.join(data_path, "figures", f"{fig_name}.pdf"))
    plt.show()
phase contrast at    300K: 3.13
phase contrast at   1300K: 65.07


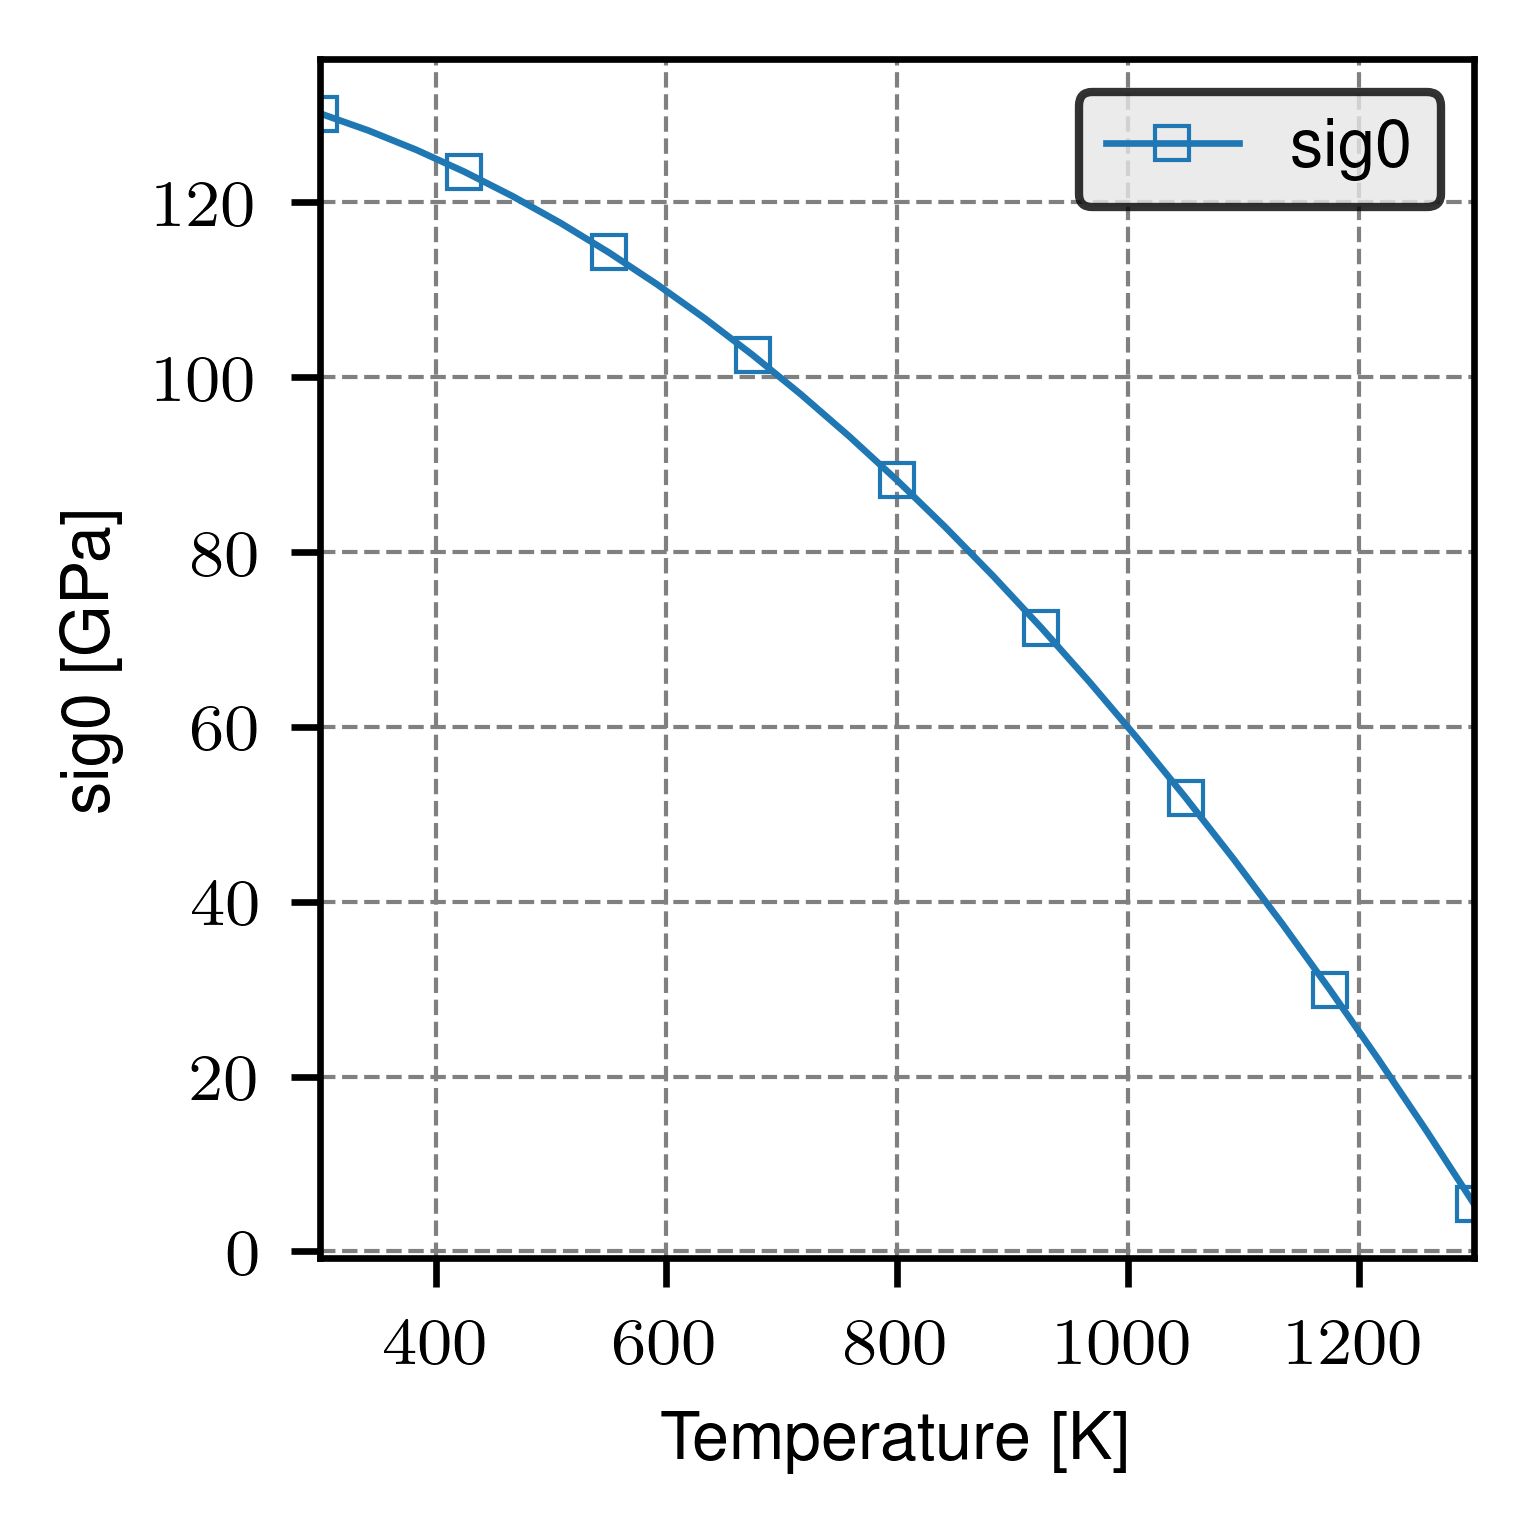
Yield stress function of the plastic phase of the material
[7]:
def my_sig_y(
    theta: float, q: float, derivative=False
) -> Union[float, Tuple[float, float]]:
    """
    Defines the yield stress function of the plastic phase of the material

    :param theta: temperature
    :type theta: float
    :param q: hardening
    :type q: float
    :param derivative: if the derivative should also be returned
    :type derivative: bool
    :return: yield stress or (yield stress, derivative of yield stress)
    :rtype: Union[float, Tuple[float, float]]
    """
    if theta < 966.06:
        sig0 = (
            1.12133e02 * theta
            + 3.49810e04
            + 1.53393e05 * np.tanh((635.754 - theta) / 206.958)
        )
    else:
        sig0 = 2023.286
    H = 5e5  # equivalent to 500 MPa
    if derivative is False:
        return sig0 + H * q
    else:
        return sig0 + H * q, H
Plot sig0 over the temperature range
[8]:
if __name__ == "__main__":
    import matplotlib.pyplot as plt
    import os

    plt.rcParams.update(
        {
            "font.size": 8,
            "lines.linewidth": 0.8,
            "lines.markersize": 4,
            "markers.fillstyle": "none",
            "lines.markeredgewidth": 0.5,
            "text.usetex": True,
            "text.latex.preamble": preamble
            # \usepackage{sansmath} \sansmath
        }
    )

    cm = 1 / 2.54  # centimeters in inches
    data_path = "../data/"

    temp1 = 300
    temp2 = 1300
    n_tests = 25
    test_temperatures = np.linspace(temp1, temp2, num=n_tests)

    parameters = np.zeros((n_tests, 1))
    for idx, temperature in enumerate(test_temperatures):
        parameters[idx, 0] = elastic_modulus_cu(temperature) / 1e6

    labels = [r"sig0"]
    markers = ["s", "d", "+", "x", "o"]
    colors = ["C0", "C1", "C2", "C3", "C4"]

    fig_name = "sig0_parameter"
    xlabel = "Temperature [K]"
    ylabel = "sig0 [GPa]"
    plt.figure(figsize=(6 * cm, 6 * cm), dpi=600)
    plt.plot(
        test_temperatures,
        parameters[:, 0],
        label=labels[0],
        marker=markers[0],
        color=colors[0],
        markevery=3,
    )
    gca1 = plt.gca()
    gca1.set_xlim([temp1, temp2])
    gca1.set_xlabel(rf"{xlabel}")
    gca1.set_ylabel(rf"{ylabel}")
    gca1.grid(ls="--", color="gray", linewidth=0.5)
    gca1.legend(loc="upper right", facecolor=(0.9, 0.9, 0.9, 0.6), edgecolor="black")
    plt.tight_layout(pad=0.025)
    plt.savefig(os.path.join(data_path, "figures", f"{fig_name}.pdf"))
    plt.show()

[ ]: